Intuition - Exponent Graphs
This class, we learned about graphing exponents, as well as translating them and dilating them. I’ll go through everything that we learned, but I think that translation of functions and asymptotes of graphs are much more worthwile to study deeply than the others.
Things we learned:
Graphing exponential functions
Exponential growth/decay
Range and domain of exponential functions
Asymptotes of exponential functions
Translating exponential functions
Graphing Exponential Functions:
I can’t really provide an intuitive way to graph exponential functions, because you just graph them, I guess.
Exponential Growth/Decay:
Exponential growth refers to when the function increases as you move to the right. Exponential decay refers to when the function decreases as you move to the right.
When you have exponential growth, the base of the exponential function is greater than one. This is because, when you multiply by something greater than one, the value increases. So, when you move right, you are multiplying by something greater than one, meaning that the function will increase.
Exponential decay has basically the same arguments. When you multipy by something less than one, the value decreases (unless there are negatives, but that doesn’t work for exponents). Then, the graph will decrease when you move right.
Range, Domain, and Asymptotes of Exponential Functions:
We’ll start with the simpler one. You can plug in any number for the domain and still have an output. Therefore, the domain is \({\rm I\!R}\). (If you’re wondering what would happen with exponents to decimals, you can reason through a simpler example by using \((x^{0.5})^2 = x\)).
Range and asymptotes are more complicated (if you didn’t know, the asymptote is a line that a function gets really close to, but doesn’t actually touch). If you know the asymptote, you know the range. This is because you know that the range will be on only one side of the asymptote (for exponential functions).
Then, how do you find the asymptote? If your exponential function is of the form \(f(x)=c_1 b^{c_2x + c_3}\), you know that it will be 0. Why?
Here, we can split it up into two cases.
Case 1: You are graphing a growing exponential function.
If this is the case, you know that moving to the left will decrease the value of the function. This means that, as you go more and more left, you will keep dividing it by b. Eventually, the denominator will become a very big number compared to the numerator, even if the numerator is a really big number.
Then, does this number ever equal to \(0\)? No (at least, not without limits), because then the numerator would have to be \(0\). But does it get really extremely close to \(0\)? Yes. Because of that, the line, \(y=0\) is an asymptote.
Case 2: You are graphing a decaying exponential function.
If this is the case, moving to the right will decrease the value of the function. Once you know this, you can use the same logic as case 1 to deduce that the asymptote is \(y=0\).
Translating Exponential Functions:
This is one of the topics where I have a visualization that I really like.
There are 2 ways to translate an exponential function of the form \(f(x) = b^{x+c_1}+c_2\). You can change either \(c_1\) or \(c_2\). The parent function would then be \(f(x) = b^x\).
More intuitive: Changing \(c_2\)
If you change \(c_2\), every input, no matter what, will return the parent function, but with all the outputs increased by \(c_2\). That means that there will be a vertical shift of \(c_2\) units in the final function.
Less intuitive: Changing \(c_1\)
If you change \(c_1\), you might expect it to start chaotically moving around (after all, you are majorly changing the exponent, which is very sensitive to changes). This doesn’t happen, though. Instead, it shifts horizontally by \(-c_1\)!
Even though this seems very weird, we can explain it with some intuition.
The first step in getting intuition for this is that the only thing we are really changing when we change \(c_1\) is the input to the exponential function. That means that what we’re really doing is just moving the x-value (input) that we put into the function to a different place.
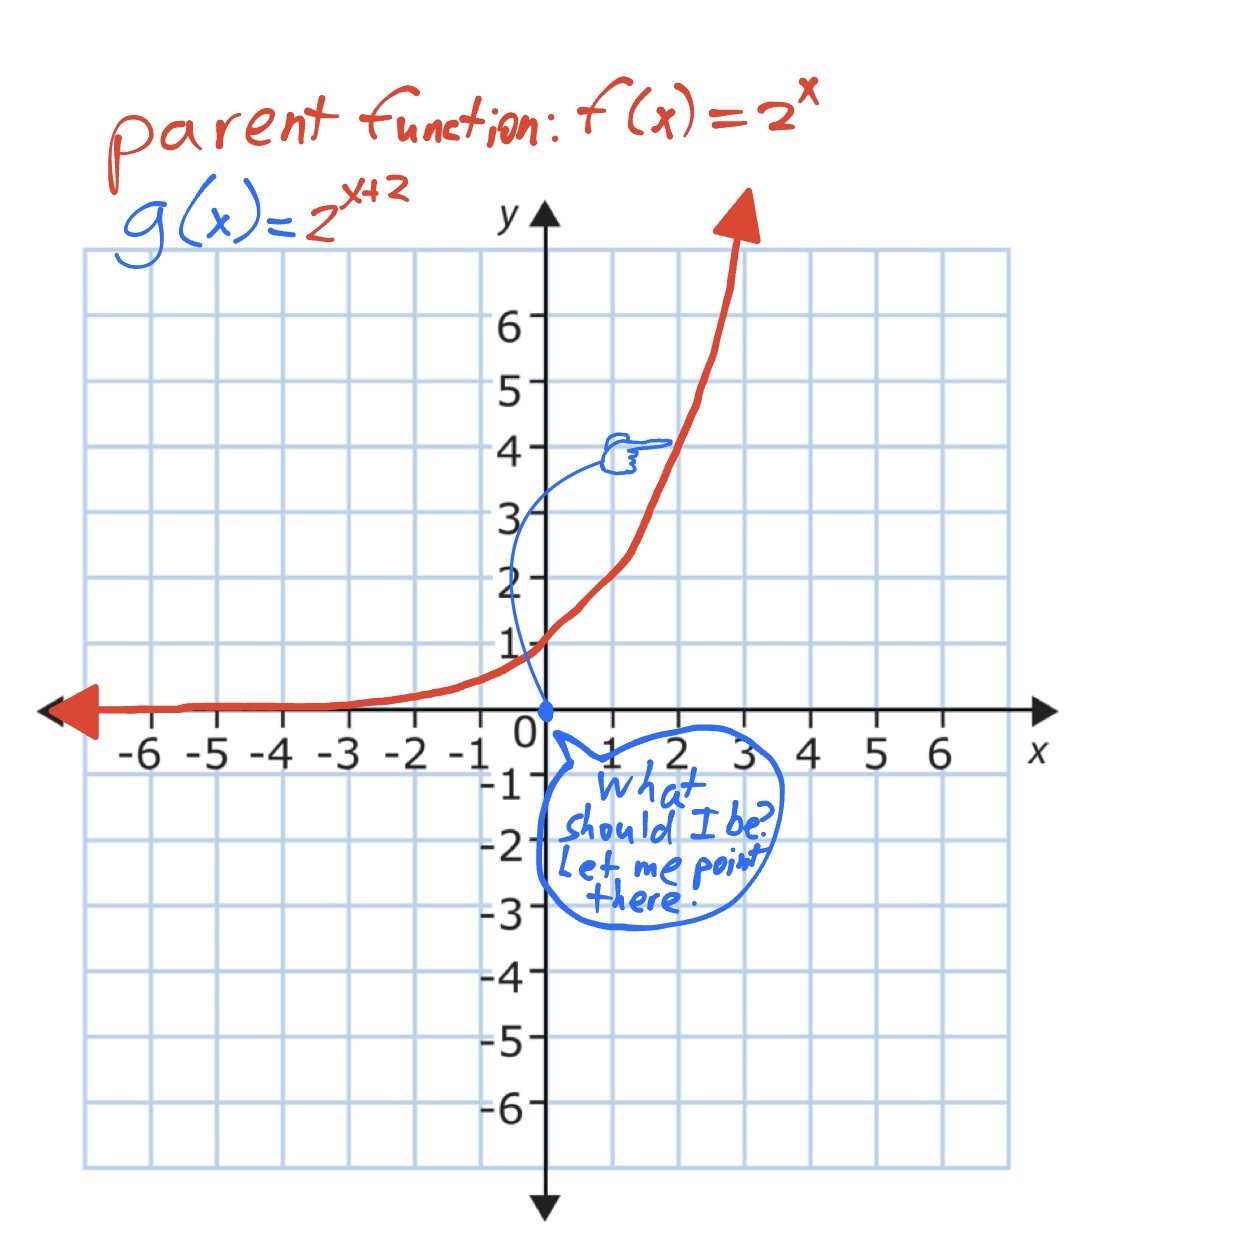
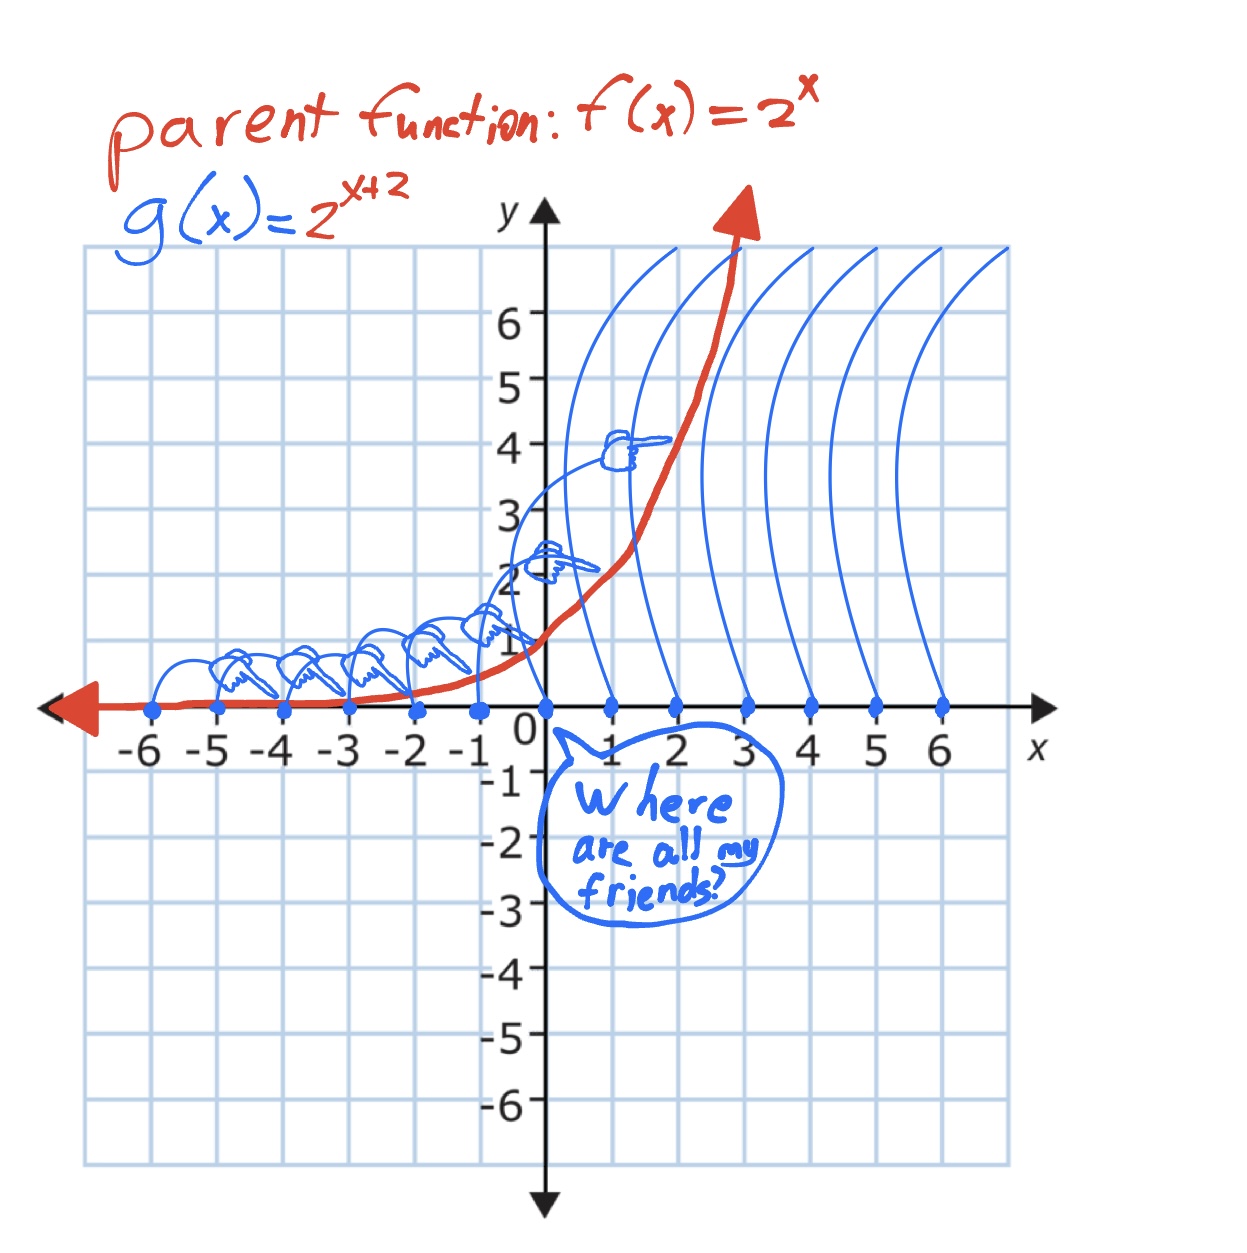
I like to think of the next step like this: We have a function \(f(x) = b^{x+2}\). The 2 part really doesn’t matter here, it could be anything. When we try to find the output when the input is, say, 0, we will instead find \(b^2\). Then, you could imagine that the output of the function at \(x=0\) to be pointing to the parent function at \(x=2\). When you do this for all possible inputs, you find that everything is pointing two units to the right.


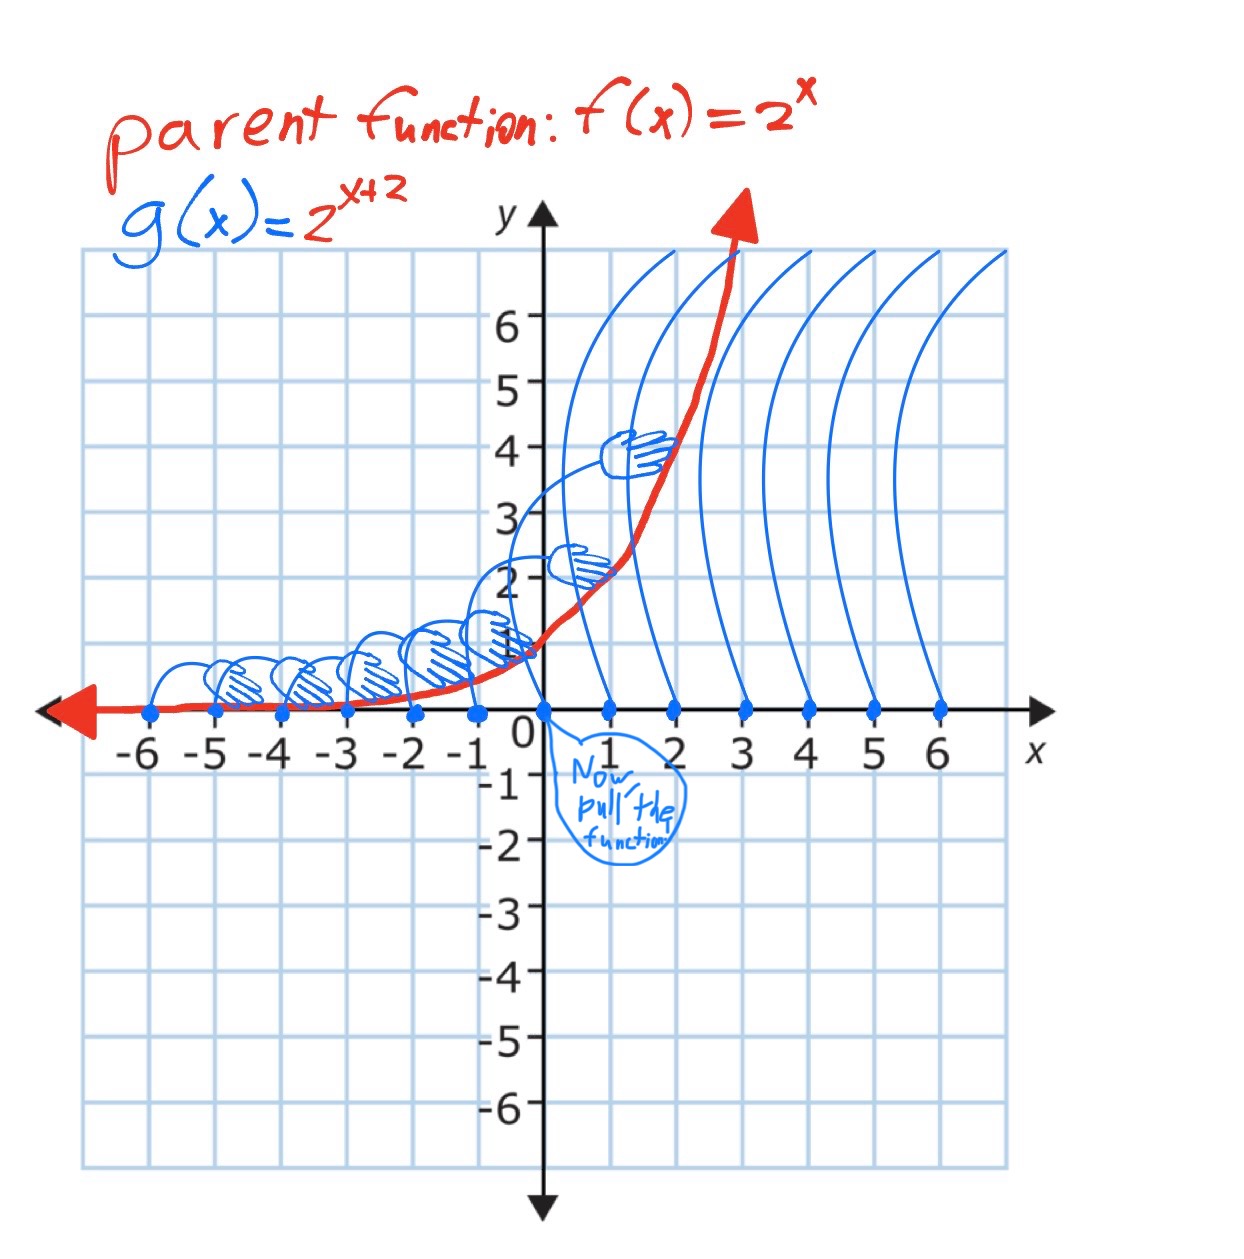
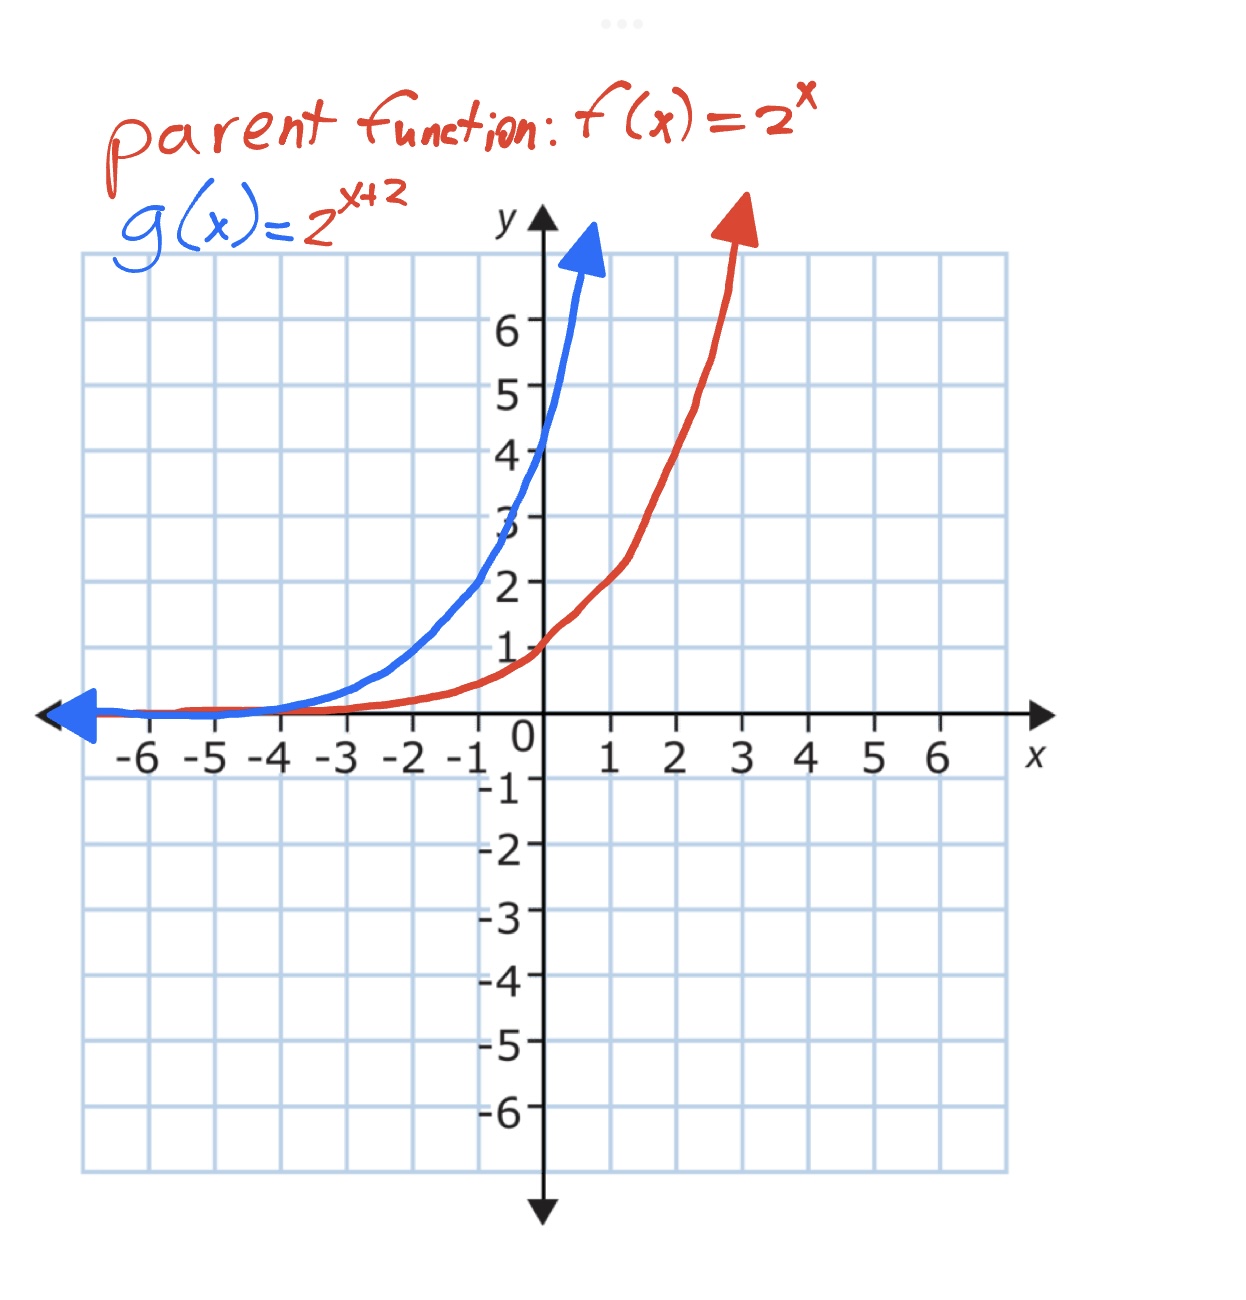
Then, you can imagine bits of the parent function moving to the places that are pointing to it. I would imagine this as all of the pointers transforming into hands, and grabbing and pulling the parent function, bit by bit, into the place where the pointer/hand originated. The total effect of this is that the parent function shifts not two units to the right, but two units left.

Finally, it becomes

These types of transformations don’t only apply to exponential functions! You could do the same thing with any parent function. This reasoning behind the transformations also doesn’t only apply to adding constants. You could also multiply things by a constant, and you would find about the same thing. Multiplying the whole output would stretch the whole function in the y-direction by a factor of the constant, while multiplying the input by a constant would squish the function in the x-direction by a factor of the constant.
That’s what I really like about this intuition: it’s not only really fun and elegant (in my opinion), but it’s also general, and can be applied to concepts outside of what it was meant to explain.
You can expect one of these posts every two days, not counting the weekends or the days we’re having an assessment.